

Most bounty payouts do not start with a clever payload. They start with recon that found an asset nobody else bothered to look at - a forgotten staging box, an old API version, a JS file leaking an internal endpoint. The exploit is the last 10%. This is the practical, copy-paste bug bounty recon workflow I would hand to someone starting a new target today, with the exact commands and the discipline that keeps it from turning into aimless scanning.

The short version (TL;DR)
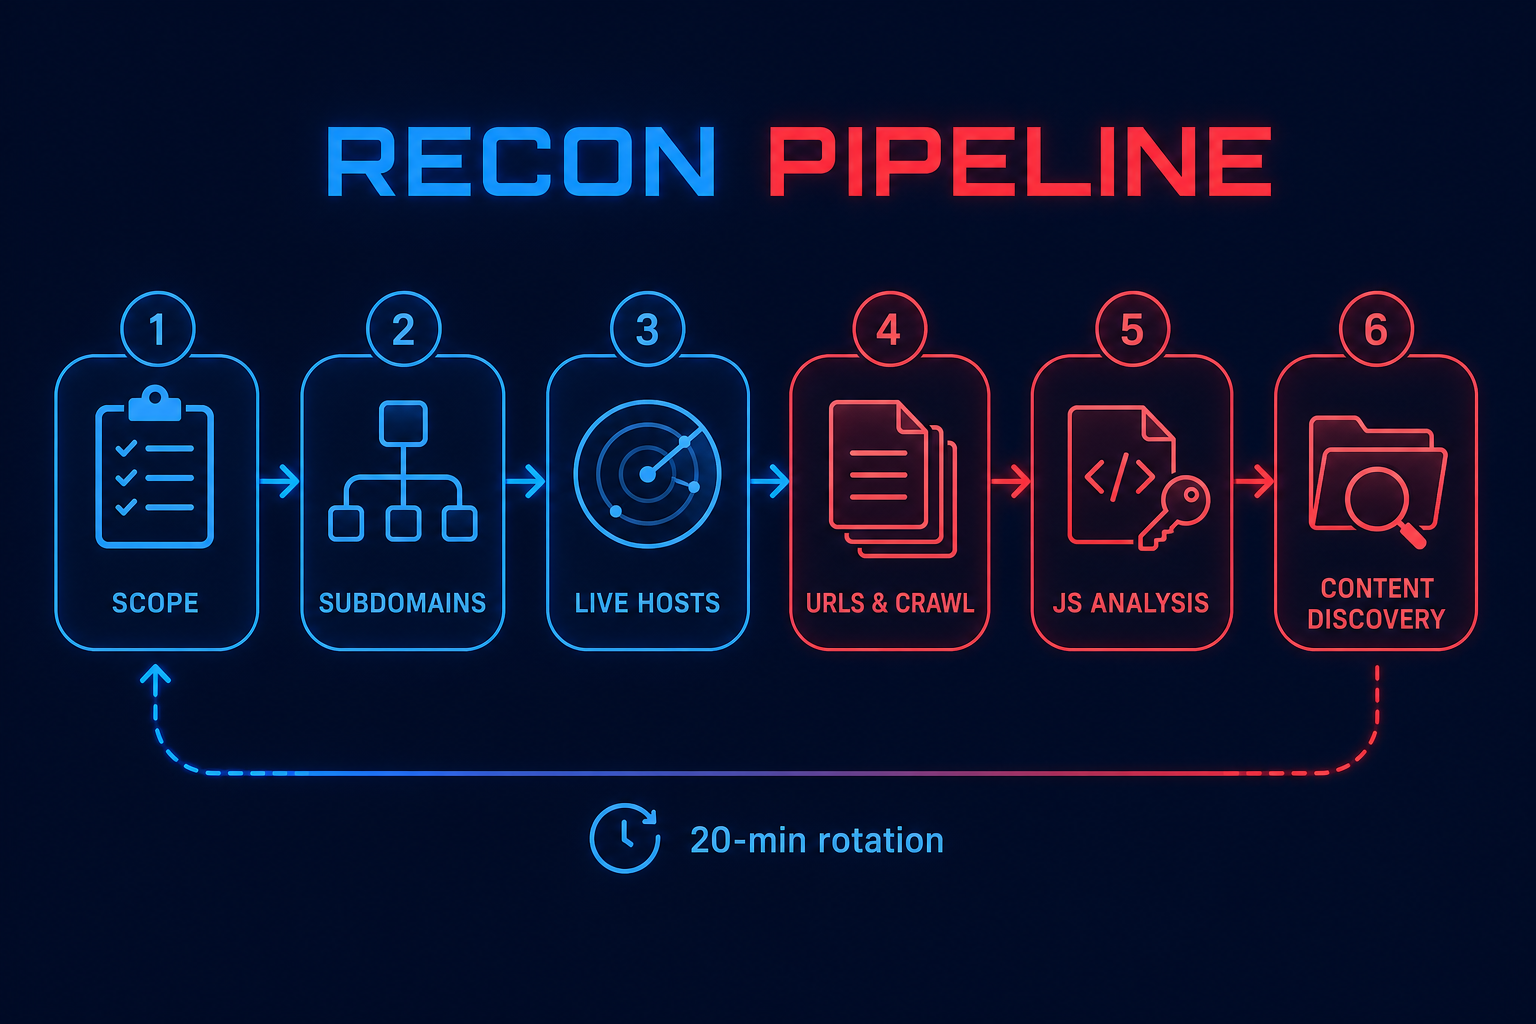
- Good recon is a repeatable pipeline: scope, subdomains, live hosts, URLs and crawling, JS analysis, content discovery. Run it the same way every time.
- Depth beats breadth in 2026. Pick one or two targets and learn them better than the developers, instead of spraying 20 programs.
- Passive first, then active. Build the asset list without touching the target, then probe what is live.
- The money is in the boring outputs: old subdomains, extra API versions, and endpoints hidden in JavaScript - not in the scanner's XSS alert.
- Use the 20-minute rotation rule so recon does not become procrastination. If a branch is dry, pivot.
Why recon decides whether you find anything
Here is the uncomfortable truth: on a mature program, the obvious stuff is already reported. The main web app has been hammered by hundreds of hunters. What has not been touched is the edge of the attack surface - the asset that got spun up for a campaign two years ago, the subdomain that points at a service that no longer exists, the mobile API that never made it into the pentest scope. Recon is how you find that edge before anyone else.
The other reason recon matters is momentum. When you map a target properly you start to see the developers' habits - how they name things, which framework they lean on, where they cut corners. That pattern recognition is what turns a plain endpoint list into a hypothesis like "this API probably trusts the id in the JWT without re-checking ownership." That hunch is worth more than any wordlist.
Step 0: Scope and a target notebook
Before a single tool runs, read the program scope and write it down. This is not busywork - testing out of scope is how you get banned, and a notebook is what separates a hunter from someone who reruns the same scan every week and forgets what they already checked.
Create one folder per target and keep flat text files you can grep later. A dead-simple structure beats a fancy one you never update.
mkdir -p ~/targets/example.com/{recon,notes,loot}
cd ~/targets/example.com/recon

# Write the scope down so you never wander out of it
echo '*.example.com, api.example.com, mobile API' > ../notes/in-scope.txt
echo 'blog.example.com (WordPress, out of scope), *.dev.example.com' > ../notes/out-of-scope.txt
Everything below writes into this folder. When the program adds a new domain, you re-run the pipeline and diff the output against last time. New assets are where fresh bugs live.
Step 1: Passive subdomain enumeration
Start passive. Passive recon pulls subdomains from public data sources - certificate transparency logs, DNS aggregators, search indexes - without sending traffic to the target. It is quiet, fast, and it often finds more than active brute forcing.
# subfinder - fast passive subdomain discovery
subfinder -d example.com -all -silent -o subs-passive.txt

# amass in passive mode for extra sources
amass enum -passive -d example.com -o subs-amass.txt

# certificate transparency via crt.sh
curl -s 'https://crt.sh/?q=%25.example.com&output=json' \
  | jq -r '.[].name_value' | sed 's/\*\.//g' | sort -u > subs-crt.txt

# merge and dedupe everything
cat subs-*.txt | sort -u > subdomains.txt
wc -l subdomains.txt
Do not skip GitHub. Developers leak internal hostnames, API keys, and staging URLs in public repositories all the time. A few targeted dorks - "example.com" api_key, "internal.example.com", org:Example password - can hand you assets that no DNS tool will ever surface.
Step 2: Resolve and probe for live hosts
A subdomain list is just names. Now find which ones actually resolve and respond, and grab the metadata that tells you where to look first - status code, title, and the tech stack.
# resolve names quickly with dnsx
dnsx -l subdomains.txt -silent -a -resp -o resolved.txt

# probe live web hosts, capture title, tech and status
cat subdomains.txt | httpx -silent -title -tech-detect -status-code \
  -o livehosts.txt

# quick look at what is interesting
grep -Ei 'admin|dev|stage|test|api|internal|jenkins|grafana' livehosts.txt
That last grep is where you slow down. An admin panel on a random subdomain, a jenkins instance, a staging copy of the app with debug on - these are the strings that make you sit up. Screenshot the interesting ones so you can triage visually instead of clicking through hundreds of hosts.
# visual triage - one screenshot per live host
gowitness scan file -f livehosts.txt --screenshot-path ./shots
Step 3: Historical URLs and active crawling
Now collect URLs, from two angles. First, pull historical URLs that already exist in public archives - these often include old parameters and endpoints the app no longer links to but still serves. Second, crawl the live app to discover current routes.
# historical URLs from archives and common crawl
cat livehosts.txt | gau --threads 5 > urls-historical.txt

# active crawl of live hosts with katana
katana -list livehosts.txt -jc -kf all -silent -o urls-crawl.txt

# merge, dedupe, and pull out URLs that take parameters
cat urls-*.txt | sort -u > urls-all.txt
grep '?' urls-all.txt | sort -u > urls-params.txt
wc -l urls-all.txt urls-params.txt
The urls-params.txt file is your testing queue. Parameters are where injection, IDOR, open redirects, and SSRF tend to hide. Before you fire payloads, sort them by parameter name so you can spot the interesting ones - url=, redirect=, file=, id=, next=.
Step 4: JavaScript analysis (the underrated goldmine)
Modern apps push a huge amount of logic into the front end, and that JavaScript is shipped straight to you. It leaks API endpoints, hidden parameters, feature flags, and sometimes hard coded secrets. Most hunters skim it. Read it.
# collect every JS file referenced by the target
cat urls-all.txt | grep -Ei '\.js($|\?)' | sort -u > jsfiles.txt

# pull endpoints and paths out of the JS
cat jsfiles.txt | while read u; do curl -s "$u"; done \
  | grep -Eo '"/[a-zA-Z0-9_/.-]+"' | sort -u > js-endpoints.txt

# hunt for secrets and keys with a dedicated scanner
nuclei -l jsfiles.txt -t http/exposures/ -silent
Every endpoint you pull out of JavaScript that is not already in your crawl output is a route the app did not want to advertise. Feed those back into your testing queue. This is also where you often find the undocumented API version - /api/v1/ is locked down, but /api/internal/ referenced in a bundle is wide open.
Step 5: Content and API endpoint discovery
Finally, brute force the paths that are not linked anywhere. Use a good wordlist for general content, and an API-specific wordlist for anything that looks like an API host.
# general content discovery with ffuf
ffuf -u https://api.example.com/FUZZ -w ~/wordlists/raft-medium-directories.txt \
  -mc 200,201,204,301,302,401,403 -o ffuf-api.json

# API-focused route discovery with kiterunner
kr scan https://api.example.com -w ~/wordlists/routes-large.kite
A 401 or 403 is not a dead end - it means the route exists but wants auth. Note every one of them. Those are your future broken access control and mass assignment test cases once you have a session.
Step 6: Map the app before you attack it
Recon is not finished when the tools stop. The final step is manual and it is the one that actually pays: open the app in Burp, create two accounts, and map the real flows. Register, log in, change your email, create an object, share it, delete it. Watch every request.
- Authentication model - how are sessions issued, are they JWTs, what is in the token, does anything trust a client-supplied id.
- Role and permission inventory - what can a normal user do versus an admin, and which requests enforce that on the server.
- Business logic - map multi-step flows fully (checkout, invites, password reset). A flow you do not understand cannot be tested for logic flaws.
- Object ownership - note every request that references an id you own, then plan to replay it against an object you do not.
This is where recon turns into findings. You are no longer looking for bugs at random - you have a map, a list of roles, and a queue of parameters and endpoints, so every test has a purpose.
Putting it together: a copy-paste recon script
Here is the whole passive-to-active flow as one script. Point it at a domain, let it run, and come back to a folder full of sorted, greppable output. Treat it as a starting point and tune the wordlists and tools to your taste.
#!/usr/bin/env bash
# usage: ./recon.sh example.com
set -euo pipefail
DOMAIN="$1"
OUT="$HOME/targets/$DOMAIN/recon"
mkdir -p "$OUT" && cd "$OUT"

echo "[*] subdomains"
subfinder -d "$DOMAIN" -all -silent > subs.txt
amass enum -passive -d "$DOMAIN" >> subs.txt || true
sort -u subs.txt -o subdomains.txt

echo "[*] live hosts"
httpx -l subdomains.txt -silent -title -tech-detect -status-code > livehosts.txt
awk '{print $1}' livehosts.txt | sort -u > live-urls.txt

echo "[*] urls"
cat live-urls.txt | gau --threads 5 > urls.txt || true
katana -list live-urls.txt -jc -silent >> urls.txt || true
sort -u urls.txt -o urls-all.txt
grep '?' urls-all.txt | sort -u > urls-params.txt || true

echo "[*] javascript"
grep -Ei '\.js($|\?)' urls-all.txt | sort -u > jsfiles.txt || true

echo "[+] done. review: livehosts.txt urls-params.txt jsfiles.txt"
Timing discipline: the 20-minute rotation rule
Recon can quietly become procrastination. You feel productive because tools are running, but you are not actually hunting. The fix is a simple timer. Give any single branch of recon about 20 minutes. If it is not producing new leads, pivot - to a different subdomain, a different vulnerability class, the API, or the mobile app. Stay on the same target to keep your momentum, but do not marry a dead end.
Pair that with a hard stop. If a whole session gives you nothing after a couple of hours, write down where you stopped in your notebook and come back fresh. The notebook is what lets you resume in five minutes instead of restarting from zero.
Common recon mistakes that cost you bugs
- Going wide instead of deep. Twenty shallow targets lose to one target you know better than its developers.
- Trusting scanner output as proof. Automation finds candidates. You confirm them by hand before writing a word of a report.
- Ignoring JavaScript. The endpoint that pays is usually the one buried in a bundle, not the one on the sitemap.
- Never re-running recon. Programs add scope constantly. The hunter who diffs new assets weekly gets there first.
- No notes. If you cannot say what you already tested, you will waste hours re-testing it.
Frequently asked questions
Is automated recon against a target legal?
Only within an authorized scope. On a bug bounty program, stick strictly to the assets and rules listed in the policy. Passive recon against public data is generally safe, but active scanning of anything you are not authorized to test can be a crime. When in doubt, do not.
Passive or active recon - which first?
Passive first, always. Build the full asset picture from public sources without touching the target, then move to active probing of what is in scope and live. It is quieter, it is safer, and it usually gives you the most surprising assets.
Do I need to write my own tools?
No. The tools in this post - subfinder, amass, httpx, gau, katana, ffuf, nuclei - cover the vast majority of recon. The edge is not a custom tool, it is how carefully you read the output and how well you map the application by hand.
How is AI changing recon in 2026?
AI is great at the grunt work - summarizing large JS files, drafting hypotheses from request and response pairs, and speeding up report writing. It is not a replacement for validation. Let it accelerate recon and analysis, then confirm every finding yourself. We cover that split in our AI bug bounty workflow post.
Conclusion
Recon is not the glamorous part of hacking, but it is the part that decides whether you have anything to hack at all. Run the same pipeline every time - scope, subdomains, live hosts, URLs, JavaScript, content discovery - then close the laptop tools and map the app by hand. Go deep on one target, keep a notebook, respect the timer, and re-run as scope grows. Do that consistently and you will keep finding the assets everyone else walked past. If you want the vulnerability side of the house, our Vulnerability Explain docs break down what to do with everything this workflow uncovers.
Pingback: Cloud Misconfig Bounty Hunting in 2026: Open Buckets, Firebase, and Secrets - SecurityCipher